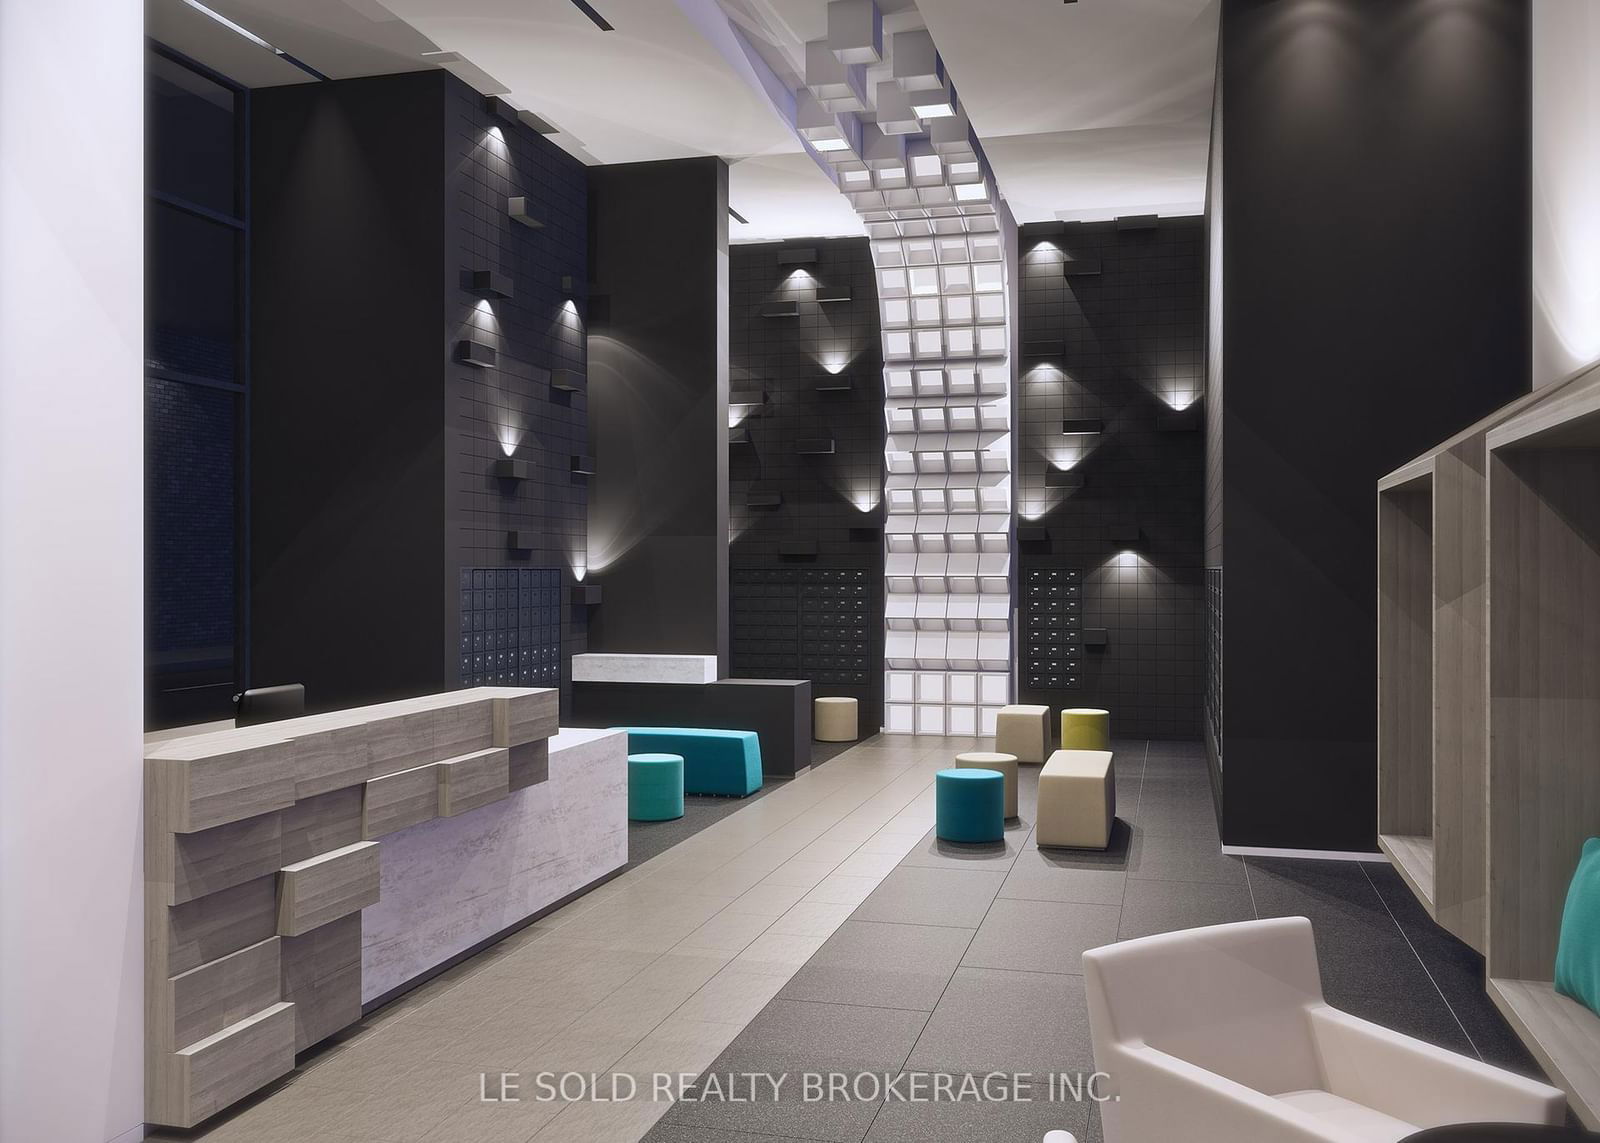
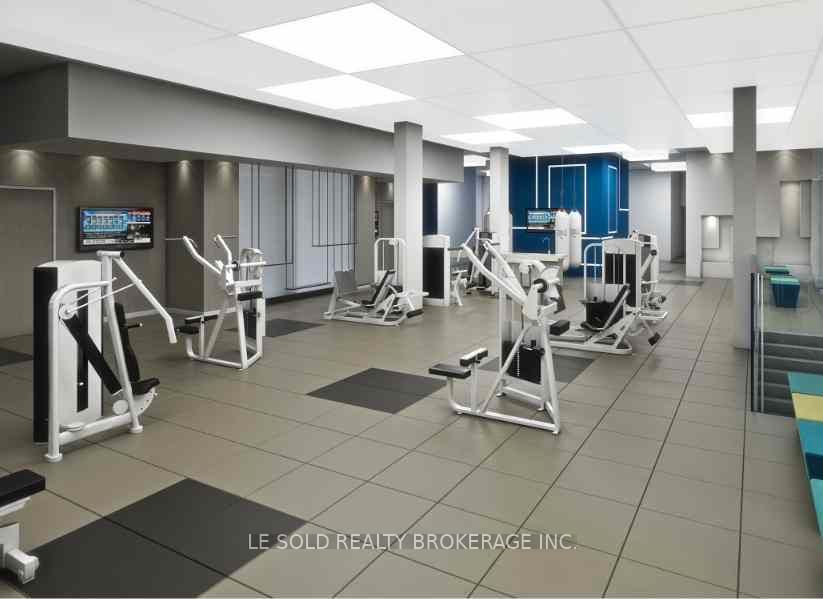
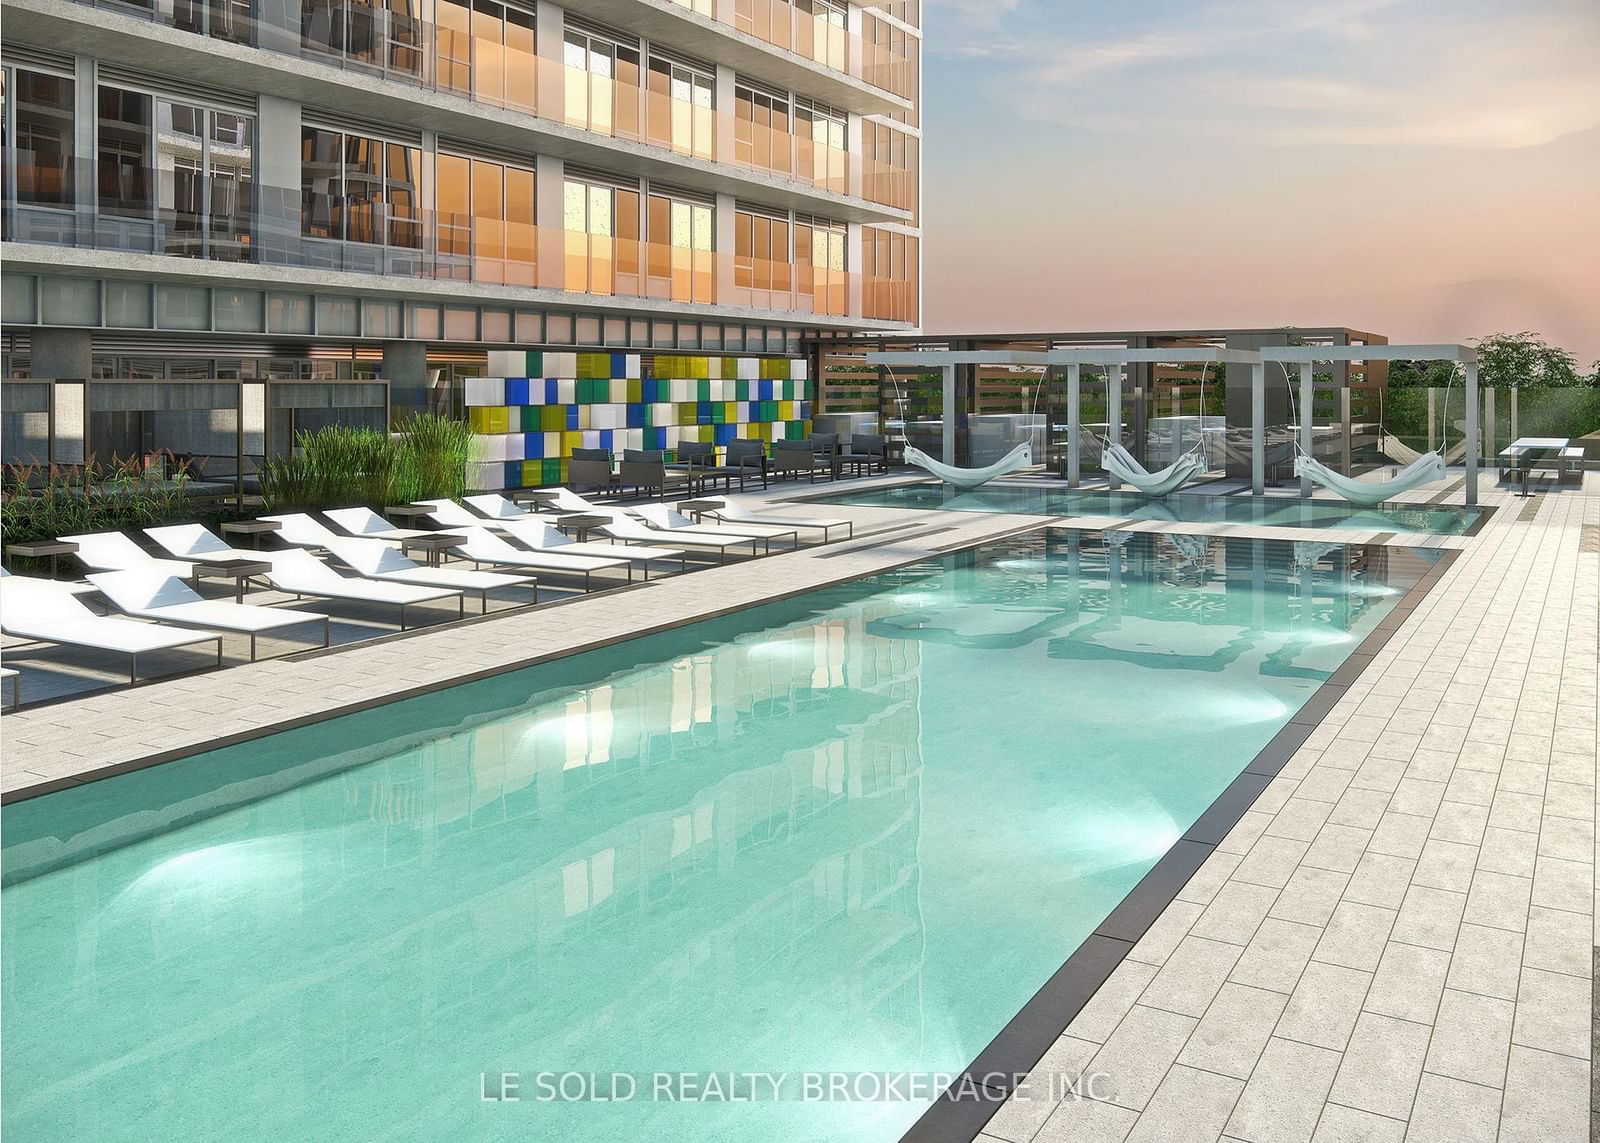
223 - 99 Broadway Ave
Listing History
Unit Highlights
Property Type:
Condo
Maintenance Fees:
$0/mth
Taxes:
$2,300 (2025)
Cost Per Sqft:
$767/sqft
Outdoor Space:
Balcony
Locker:
None
Exposure:
West
Possession Date:
To Be Arranged
Amenities
About this Listing
Great opportunity to own an upscale and modern condo unit, located in the Yonge and Eglinton neighborhood, the Heart of Midtown Toronto. 1+1 bedroom with 2 bathrooms. 690 sqft + 70 sqft open balcony. Den can be the second bedroom. Spacious and bright living space. Convenient location, steps to Subway Station, Cafes, Restaurants, Shops, Parks and Schools. Condo amenities include 24-hour concierge, outdoor pool, gym, party room, rooftop deck and more.
ExtrasFridge, Stove, Dishwasher, Washer & Dryer.
le sold realty brokerage inc.MLS® #C12058398
Fees & Utilities
Maintenance Fees
Utility Type
Air Conditioning
Heat Source
Heating
Room Dimensions
Living
Combined with Kitchen, Combined with Dining, Walkout To Balcony
Bedroom
Closet, 3 Piece Ensuite
Den
Separate Room
Similar Listings
Explore Mount Pleasant West
Commute Calculator
Demographics
Based on the dissemination area as defined by Statistics Canada. A dissemination area contains, on average, approximately 200 – 400 households.
Building Trends At CityLights on Broadway
Days on Strata
List vs Selling Price
Or in other words, the
Offer Competition
Turnover of Units
Property Value
Price Ranking
Sold Units
Rented Units
Best Value Rank
Appreciation Rank
Rental Yield
High Demand
Market Insights
Transaction Insights at CityLights on Broadway
| Studio | 1 Bed | 1 Bed + Den | 2 Bed | 2 Bed + Den | 3 Bed | 3 Bed + Den | |
|---|---|---|---|---|---|---|---|
| Price Range | $397,000 - $425,000 | $442,500 - $500,000 | $485,000 - $666,000 | $626,800 - $738,000 | No Data | No Data | No Data |
| Avg. Cost Per Sqft | $1,178 | $1,077 | $1,029 | $974 | No Data | No Data | No Data |
| Price Range | $1,650 - $2,050 | $1,800 - $2,500 | $1,900 - $2,950 | $1,400 - $3,500 | $3,250 - $4,000 | No Data | No Data |
| Avg. Wait for Unit Availability | 131 Days | 40 Days | 39 Days | 51 Days | 518 Days | No Data | No Data |
| Avg. Wait for Unit Availability | 15 Days | 4 Days | 5 Days | 5 Days | 120 Days | No Data | No Data |
| Ratio of Units in Building | 10% | 30% | 31% | 28% | 2% | 1% | 1% |
Market Inventory
Total number of units listed and sold in Mount Pleasant West


