Skip to main

    11 - 264 Finch Ave E

    52 Days on Strata
    Est Sell Timeframe:
    13 Days
    $787,500
    2 Beds + 1
    2 Bath
    1 Parking
    900 - 999 SQFT

    Listing History

    2025 - Feb 21 • 52 days on Strata
    for sale
    $787,500
    Apr 06, 2023 • 89 days on Strata
    suspended
    $928,500
    Receive listing updates for Newtonbrook

    Details

    Ownership Type:

    Condominium

    Property Type:

    Townhouse

    Maintenance Fees:

    $489/mth

    Taxes:

    $3,662 (2024)

    Cost Per Sqft:

    $788 - $875/sqft

    Outdoor Space:

    Terrace

    Locker:

    None

    Exposure:

    North

    Possession Date:

    To Be Arranged

    Amenities

    Security System
    Visitor Parking

    About this Listing

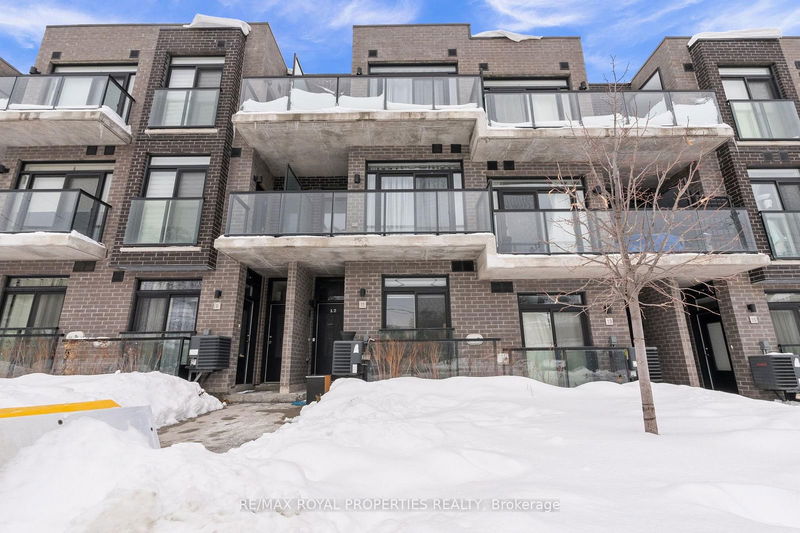
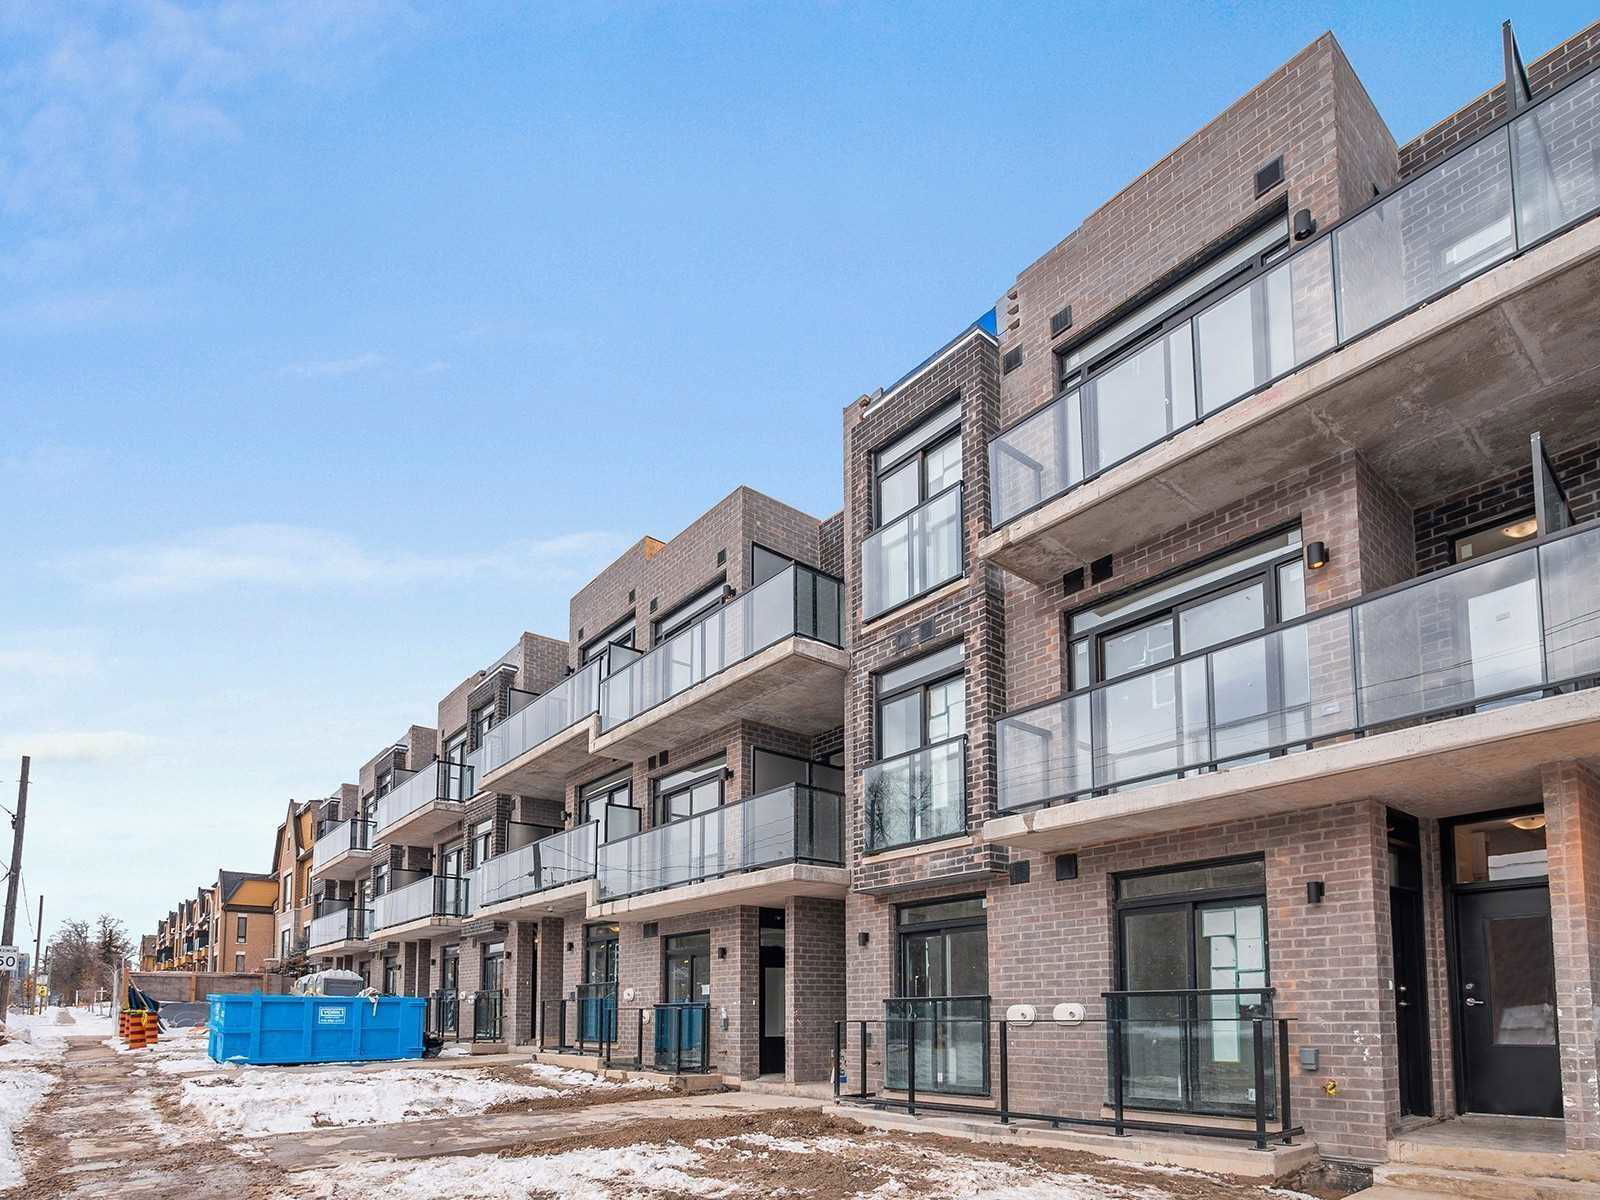
    2 Bed + Den, 2 Bath Townhome, 15 Min Walk To Finch Subway. Close To Bayview Village, North York Centre, YMCA, Supermarket, Seneca College, 401, York University. Toronto's Desirable Bayview Village. Close To Schools, Parks, Highways.

    ExtrasMicrowave, Dishwasher, Fridge, Stove, Washer, Dryer.

    re/max royal properties realtyMLS® #C11982994

    Fees & Utilities

    Maintenance Fees

    Included in Fees
    Parking
    Building Maintenance
    Not Included
    Hydro
    Heat
    Air Conditioning
    Water

    Utility Type

    Air Conditioning

    Central Air

    Heat Source

    No Data

    Heating

    Forced Air

    Room Dimensions

    Living

    Combined with Dining, Laminate

    22.51 x 8.83ft

    Dining

    Combined with Living, Laminate

    22.51 x 8.5ft

    Den

    Laminate

    22.51 x 8.5ft

    Kitchen

    Stainless Steel Appliances, Combined with Dining, Laminate

    34.65 x 30.12ft

    Primary

    3 Piece Ensuite, Closet, Laminate

    12.99 x 6.76ft

    2nd Bedroom

    Closet, Laminate, Window

    8.5 x 9.74ft

    Buyer's Market
    Balanced
    Seller's Market
    Winlock Towns

    Building Spotlight

    Winlock Towns
    260-268 Finch Avenue E

    Similar Listings

    Explore Newtonbrook


    Commute Calculator

    Map Location Unknown
    map of location
    2/10
    Walkability
    A sight of a grocery store is as rare as a unicorn sighting.
    7/10
    Transit
    Transit's there for you, like a loyal golden retriever.
    5/10
    Bikeability
    You'll have a love-hate relationship with your gears. Mostly hate.

    Mortgage Calculator


    Demographics

    Based on the dissemination area as defined by Statistics Canada. A dissemination area contains, on average, approximately 200 – 400 households.

    Population
    16,570
    Average Individual Income
    $67,675
    Average Household Size
    3 persons
    Average Age
    42
    Average Household Income
    $115,798
    Dominant Housing Type
    Detached
    Population By Age
    0 - 14
    12%
    15 - 19
    1%
    20 - 34
    20%
    35 - 49
    17%
    50 - 64
    23%
    65+
    23%
    0 - 1415 - 1920 - 3435 - 4950 - 6465+0%5%10%15%20%
    Household Income
    $0 - $30,000
    52%
    $30,000+
    25%
    $60,000+
    11%
    $90,000+
    6%
    $125,000+
    4%
    $0 - $30K$30K+$60K+$90K+$125K+0%10%20%30%40%50%
    Housing Types & Tenancy
    Detached
    51%
    Semi Detached
    20%
    Low Rise Apartment
    12%
    High Rise Apartment
    7%
    Duplex
    7%
    Marital Status
    49%Married
    31%Never Married
    6%Divorced
    6%Widowed
    3%Common Law
    2%Separated
    Commute
    75%Car
    20%Public Transit
    1%Walk
    1%Other
    Languages (Primary Language)
    English
    54%
    Cantonese
    17%
    Mandarin
    13%
    Other
    12%
    Tamil
    3%
    Tagalog
    1%
    Education
    University and Above
    28%
    High School
    27%
    None
    20%
    College
    16%
    Apprenticeship
    3%
    University Below Batchelor
    3%
    Major Field of Study
    Business Management
    28%
    Architecture & Engineering
    18%
    Health & Related Fields
    11%
    Social Sciences
    10%
    Math & Computer Sciences
    7%
    Physical Sciences
    5%
    Humanities
    4%
    Education
    4%
    Personal, Protective & Transportation Services
    3%
    Visual & Performing Arts
    2%
    Agriculture & Natural Resources
    1%


    Days on Strata

    Units at Winlock Towns spend an average of
    N/A
    Days on Strata
    based on recent sales

    List vs Selling Price

    On average, these condos sell for
    100%
    of the list price.
    Or in other words, the
    entire list price

    Offer Competition

    Condos in this building have a
    LOW
    chance of receiving
    Multiple Offers
    compared to other buildings in Newtonbrook

    Turnover of Units

    On average, each unit is owned for
    N/A
    YEARS before being sold again

    Property Value

    0%
    Increase in property value within the past twelve months

    Price Ranking

    N/A
    Highest price per SQFT out of 51 condos in the Newtonbrook area

    Sold Units

    0
    Units were Sold over the past twelve months

    Rented Units

    6
    Units were Rented over the past twelve months

    Best Value Rank

    Winlock Towns offers the
    ?
    N/A
    best value out of 51 condos in the Newtonbrook neighbourhood

    Appreciation Rank

    Winlock Towns has the
    ?
    N/A
    highest ROI out of 51 condos in the Newtonbrook neighbourhood

    Rental Yield

    Winlock Towns yields the
    ?
    N/A
    highest rent prices out of 51 condos in the Newtonbrook neighbourhood

    High Demand

    Winlock Towns is the
    ?
    N/A
    most popular building out of 51 condos in the Newtonbrook neighbourhood

    Market Insights

    Transaction Insights at Winlock Towns

    2 Bed2 Bed + Den3 Bed
    Price RangeNo DataNo DataNo Data
    Avg. Cost Per SqftNo DataNo DataNo Data
    Avg. Wait for Unit AvailabilityNo DataNo DataNo Data
    Ratio of Units in Building52%40%4%

    Market Inventory

    Total number of units listed and sold in Newtonbrook


    The information on this website is taken from sources deemed reliable. However, the accuracy cannot be guaranteed and it is the responsibility of the website user to personally verify all information. The property information herein is derived from various sources that may include, but are not limited to, municipal records and the Multiple Listing Service, and may include approximations.

    Copyright © 2025 Strata.ca. All rights reserved.