Maintenance Fees
Lighthouse West Tower Condos vs The Waterfront Area


Condo
$688/mth
$3,863 (2024)
$1,204/sqft
Balcony
Owned
East
June 1, 2025
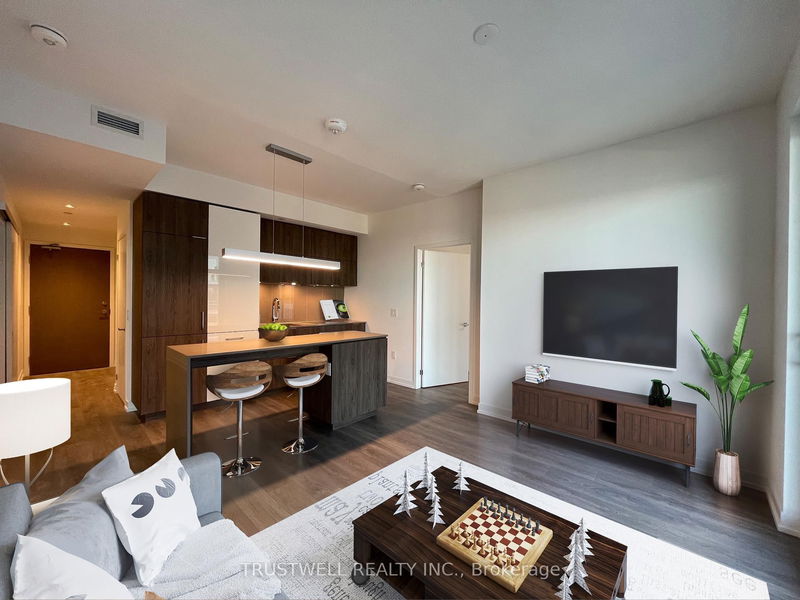
The Lighthouse By Daniels. 2 Bedroom + 2 Full Washrooms Unit 705 Sqft With Wide Open 192 Sqft Balcony! Eat In Kitchen With High End Built In Appliances. 1 Parking And 1 Locker. The Convenience Of Being Next To Loblaws, The Gardner, Sugar Beach, And Walk To St. Lawrence Market And The Distillery District.
ExtrasBuilt In Fridge, Dishwasher, Smooth Flat Top Stove, Built In Oven, Microwave,Stackable Front Load Washer And Dryer. Window Coverings.
trustwell realty inc.MLS® #C11995506
Laminate, Combined with Dining, Walkout To Balcony
Laminate, Combined with Living, Walkout To Balcony
Laminate, Built-in Appliances, Open Concept
Laminate, Ensuite Bath
Laminate, Built-in Closet
Based on the dissemination area as defined by Statistics Canada. A dissemination area contains, on average, approximately 200 – 400 households.
| Studio | 1 Bed | 1 Bed + Den | 2 Bed | 2 Bed + Den | 3 Bed | 3 Bed + Den | |
|---|---|---|---|---|---|---|---|
| Price Range | $430,000 - $439,000 | $546,000 - $605,000 | $612,500 - $736,888 | $621,400 - $740,000 | No Data | No Data | No Data |
| Avg. Cost Per Sqft | $1,139 | $1,067 | $1,141 | $916 | No Data | No Data | No Data |
| Price Range | $1,900 - $2,300 | $2,100 - $2,650 | $2,200 - $3,005 | $3,000 - $5,000 | $3,600 - $3,650 | $5,300 - $5,400 | No Data |
| Avg. Wait for Unit Availability | 161 Days | 48 Days | 60 Days | 64 Days | 222 Days | 272 Days | 746 Days |
| Avg. Wait for Unit Availability | 21 Days | 8 Days | 10 Days | 9 Days | 452 Days | 184 Days | 137 Days |
| Ratio of Units in Building | 11% | 33% | 27% | 27% | 2% | 2% | 1% |
Total number of units listed and sold in Waterfront
