Maintenance Fees
Tableau Condominiums vs The Queen West Area


Condo
June 16, 2025
1 Year
No
Balcony
Yes
North
None
Main
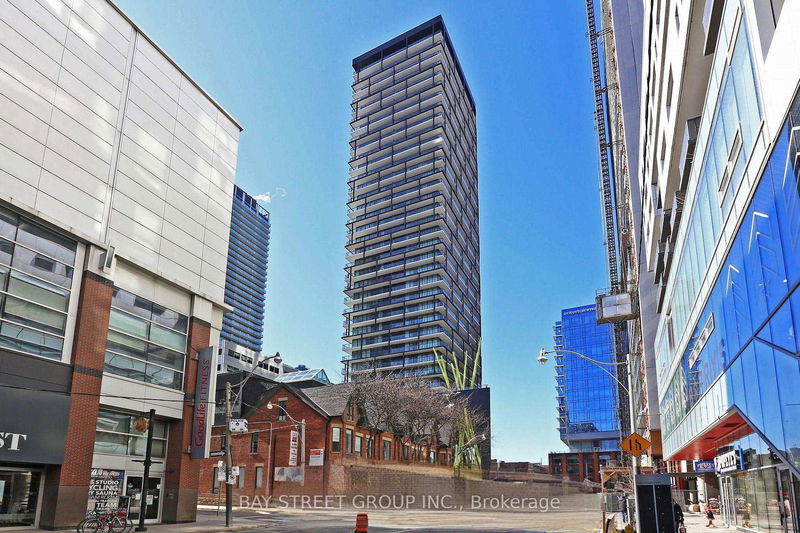
Luxury "Tableau Condo" offers a 1+1 bedroom unit with an uninterrupted North view of the City. Den is huge enough for a 2nd bedroom or study with sliding door. This well-designed suite that maximizes space and functionality. 9' Floor-to-ceiling windows, kitchen featuring granite countertops and high end built-in appliances. Enjoy the impressive amenities and the convenience of a concierge service. Located where Financial District meets Entertainment District, close to Hospital, TTC, Queen West, King West & Financial District. Walking distance to numerous amenities. Furnished option available.
ExtrasBuilt-In Fridge, Dishwasher, Stovetop, Oven, Range, Washer & Dryer.
bay street group inc.MLS® #C12063986
Room dimensions are not available for this listing.
Based on the dissemination area as defined by Statistics Canada. A dissemination area contains, on average, approximately 200 – 400 households.
| Studio | 1 Bed | 1 Bed + Den | 2 Bed | 3 Bed | 3 Bed + Den | |
|---|---|---|---|---|---|---|
| Price Range | No Data | $520,000 | $575,000 - $682,500 | $725,000 - $743,000 | No Data | No Data |
| Avg. Cost Per Sqft | No Data | $1,000 | $1,087 | $1,156 | No Data | No Data |
| Price Range | $2,000 - $2,250 | $2,150 - $2,450 | $2,400 - $3,100 | $2,700 - $3,600 | $3,600 - $4,600 | No Data |
| Avg. Wait for Unit Availability | 381 Days | 93 Days | 32 Days | 49 Days | 157 Days | No Data |
| Avg. Wait for Unit Availability | 63 Days | 21 Days | 11 Days | 19 Days | 56 Days | No Data |
| Ratio of Units in Building | 6% | 19% | 42% | 24% | 10% | 1% |
Total number of units listed and leased in Queen West
