Maintenance Fees
Tableau Condominiums vs The Queen West Area


Condo
June 1, 2025
1 Year
No
Enclosed/Solarium
No
North
Owned
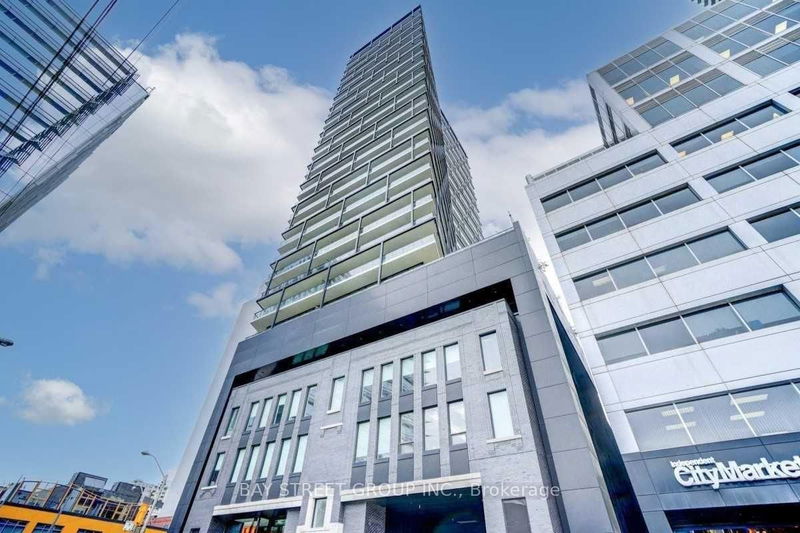
Location! Location! Open Concept One Br+Den. Den Can Be Used As 2nd Bedroom With Sliding Door. Huge 105 Sq. Ft. Balcony. Bright Unit With Gorgeous City View. Walking Distance To Rogers Centre, Cn Towner, China Town, U Of T & Ryerson Universities, Hospital. All Entertainment & Financial District, Restaurant, Supermarket.
ExtrasFridge,Cooking Top, B/I Dishwasher, Microwave, Washer & Dryer, Window Coverings.
bay street group inc.MLS® #C12058126
Combined with Dining, Laminate
Combined with Living, Laminate
Open Concept, Laminate, Combined with Living
Closet, Laminate
Sliding Doors, Laminate, Separate Room
Based on the dissemination area as defined by Statistics Canada. A dissemination area contains, on average, approximately 200 – 400 households.
| Studio | 1 Bed | 1 Bed + Den | 2 Bed | 3 Bed | 3 Bed + Den | |
|---|---|---|---|---|---|---|
| Price Range | No Data | $520,000 | $575,000 - $682,500 | $725,000 - $743,000 | No Data | No Data |
| Avg. Cost Per Sqft | No Data | $1,000 | $1,087 | $1,156 | No Data | No Data |
| Price Range | $2,000 - $2,250 | $2,150 - $2,450 | $2,400 - $3,100 | $2,700 - $3,600 | $3,600 - $4,600 | No Data |
| Avg. Wait for Unit Availability | 381 Days | 93 Days | 32 Days | 49 Days | 157 Days | No Data |
| Avg. Wait for Unit Availability | 63 Days | 21 Days | 11 Days | 19 Days | 56 Days | No Data |
| Ratio of Units in Building | 6% | 19% | 42% | 24% | 10% | 1% |
Total number of units listed and leased in Queen West
