Maintenance Fees
Tableau Condominiums vs The Queen West Area


Condo
May 1, 2025
1 Year
No
Balcony
Yes
North
None
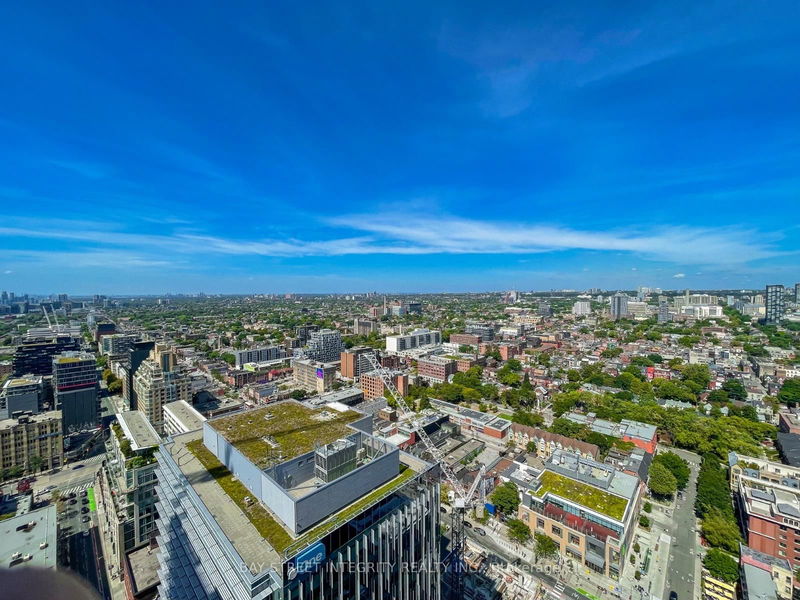
Tableau is a 36-storey mixed-use building designed by Wallman Architects featuring 415 residential suites, 25,000 sg ft of office space and retail space at the ground level. Suites and amenities arebeautifully designed by Cecconi Simone with outdoor space and landscape created by Claude CormierLandscape Architects.1 bed + den, and 1 parking stall (610 Sqft + 105 Sqft Balcony) Sweepingpanoramic views, modern finishes and great layout with sliding doors. Excellent location in downtownToronto - walking distance to public transportation, restaurants, grocery stores, shopping.
ExtrasAll furniture as shown in the photos except TV
bay street integrity realty inc.MLS® #C12000158
Room dimensions are not available for this listing.
Based on the dissemination area as defined by Statistics Canada. A dissemination area contains, on average, approximately 200 – 400 households.
| Studio | 1 Bed | 1 Bed + Den | 2 Bed | 3 Bed | 3 Bed + Den | |
|---|---|---|---|---|---|---|
| Price Range | No Data | $520,000 | $575,000 - $682,500 | $725,000 - $743,000 | No Data | No Data |
| Avg. Cost Per Sqft | No Data | $1,000 | $1,087 | $1,156 | No Data | No Data |
| Price Range | $2,000 - $2,250 | $2,150 - $2,450 | $2,400 - $3,100 | $2,700 - $3,600 | $3,600 - $4,600 | No Data |
| Avg. Wait for Unit Availability | 381 Days | 93 Days | 32 Days | 49 Days | 157 Days | No Data |
| Avg. Wait for Unit Availability | 63 Days | 21 Days | 11 Days | 19 Days | 56 Days | No Data |
| Ratio of Units in Building | 6% | 19% | 42% | 24% | 10% | 1% |
Total number of units listed and leased in Queen West
