Maintenance Fees
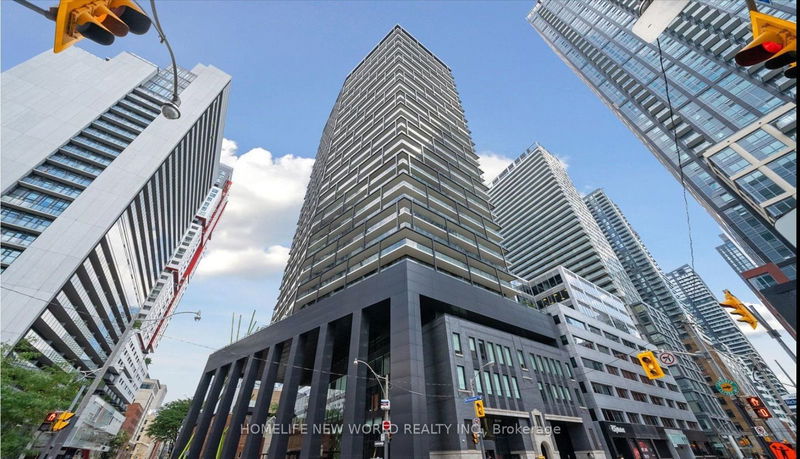
Tableau Condominiums vs The Queen West Area


Condo
$412/mth
$2,847 (2024)
$1,261/sqft
Balcony
None
North
60 to 90 days
Ensuite
Stunning Tableau 1+1 Condo Unit In the Heart of Entertainment District. Bright and Spacious, Open Concept and Functional Layout. Den can be used as 2nd Bedroom. Floor To Ceiling Windows, Huge 105 Sq. Ft. Balcony with Unobstructed City View, Amazing Amenities, Steps To Financial And Fashion District. Walking Distance To U Of T & Ryerson Universities, Hospital, And Much More!
ExtrasStove, Fridge, Dishwasher, Washer and Dryer
homelife new world realty inc.MLS® #C11930522
Open Concept, Walkout To Balcony, Large Window
Backsplash, Built-in Fridge, Granite Counter
Walkout To Balcony, Large Closet, Large Window
Based on the dissemination area as defined by Statistics Canada. A dissemination area contains, on average, approximately 200 – 400 households.
| Studio | 1 Bed | 1 Bed + Den | 2 Bed | 3 Bed | 3 Bed + Den | |
|---|---|---|---|---|---|---|
| Price Range | No Data | $520,000 | $575,000 - $682,500 | $725,000 - $743,000 | No Data | No Data |
| Avg. Cost Per Sqft | No Data | $1,000 | $1,087 | $1,156 | No Data | No Data |
| Price Range | $2,000 - $2,250 | $2,150 - $2,450 | $2,400 - $3,100 | $2,700 - $3,600 | $3,600 - $4,600 | No Data |
| Avg. Wait for Unit Availability | 381 Days | 93 Days | 32 Days | 49 Days | 157 Days | No Data |
| Avg. Wait for Unit Availability | 63 Days | 21 Days | 11 Days | 19 Days | 56 Days | No Data |
| Ratio of Units in Building | 6% | 19% | 42% | 24% | 10% | 1% |
Total number of units listed and sold in Queen West
