Maintenance Fees
Peter & Adelaide Condos vs The Queen West Area


Condo
$615/mth
$0 (2025)
$1,354/sqft
Terrace
Owned
South East
February 28, 2025
Ensuite
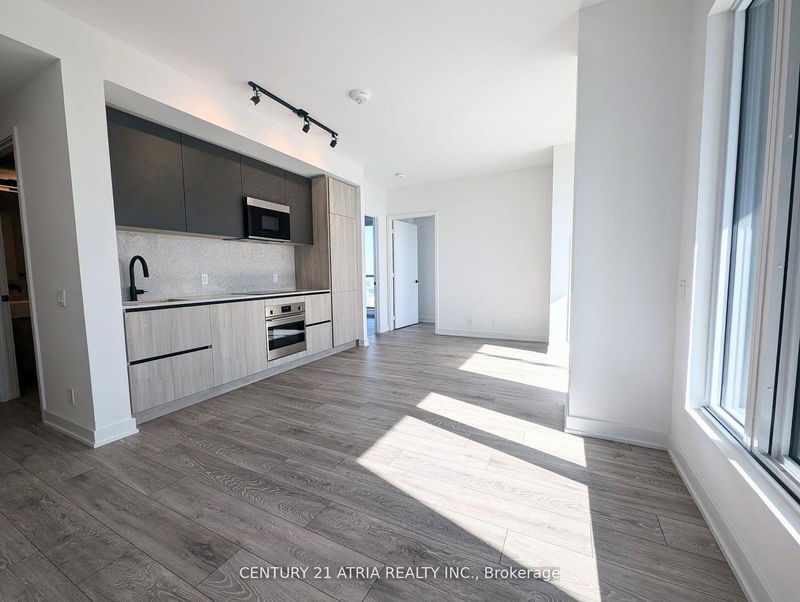
BRAND NEW DIRECT FROM BUILDER. Spacious unobstructed South East facing 3 Bed + Terrace with CN Tower & LAKE views. Over 500sf terrace with unobstructed views. Perfectly situated in downtown Toronto's core. Close proximity to PATH, Financial/Entertainment district, University Health Network, U of T, TMU, George Brown, OCAD, Subway and TTC access. Parking included. **EXTRAS** Health Network, U of T, TMU, George Brown, OCAD, Subway and TTC access. Parking included.
ExtrasFridge, stove, dishwasher, washer, dryer, microwave with built in hood fan, electric light fixtures, and all permanent fixtures now in the property.
century 21 atria realty inc.MLS® #C11952193
Based on the dissemination area as defined by Statistics Canada. A dissemination area contains, on average, approximately 200 – 400 households.
| Studio | 1 Bed | 1 Bed + Den | 2 Bed | 2 Bed + Den | 3 Bed | 3 Bed + Den | |
|---|---|---|---|---|---|---|---|
| Price Range | No Data | $485,000 - $635,000 | $590,000 - $770,000 | $720,000 - $1,070,000 | $893,000 | $875,000 - $1,340,000 | No Data |
| Avg. Cost Per Sqft | No Data | $1,171 | $1,189 | $1,142 | $1,298 | $1,138 | No Data |
| Price Range | $1,995 | $1,500 - $2,700 | $2,295 - $3,200 | $1,380 - $3,500 | $2,950 - $3,700 | $1,350 - $5,450 | No Data |
| Avg. Wait for Unit Availability | No Data | 53 Days | 53 Days | 42 Days | No Data | 87 Days | No Data |
| Avg. Wait for Unit Availability | 166 Days | 6 Days | 4 Days | 4 Days | 17 Days | 12 Days | No Data |
| Ratio of Units in Building | 1% | 19% | 32% | 30% | 7% | 9% | 1% |
Total number of units listed and sold in Queen West
