Maintenance Fees
Peter & Adelaide Condos vs The Queen West Area


Condo
$365/mth
$2,818 (2024)
$1,210/sqft
Balcony
None
East
March 3, 2025
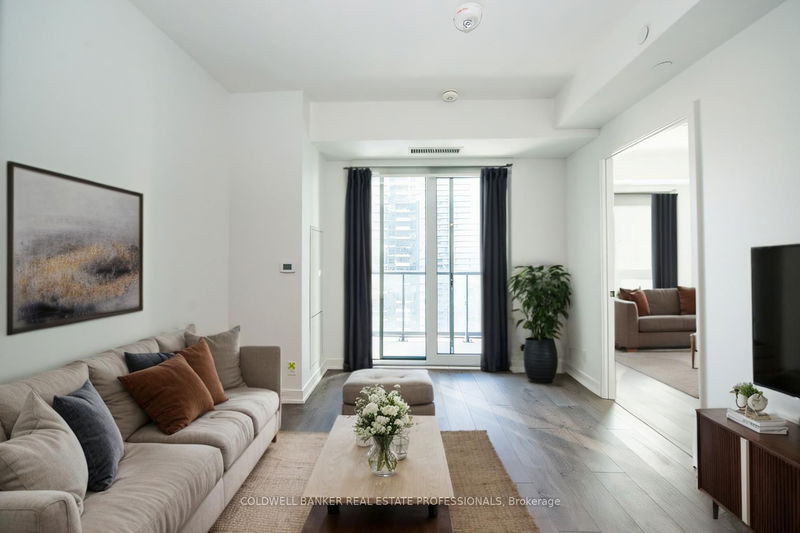
Located in the heart of downtown, this brand new never lived in condo is a spacious east facing 1+1 with stunning unobstructed views. The den could be used as an office, nursery or second bedroom. Steps to some of the world's best theatre, shopping, dining, nightlife, live music and entertainment. Close proximity to the financial district, PATH, U of T, OCAD, University Health Network and so much more. This is a luxury building in the heart of Downtown Toronto. Stunning amenities include a rooftop pool, co-working space, party lounge, fitness studio, yoga studio, kids zone, and more..
coldwell banker real estate professionalsMLS® #C11984776
Based on the dissemination area as defined by Statistics Canada. A dissemination area contains, on average, approximately 200 – 400 households.
| Studio | 1 Bed | 1 Bed + Den | 2 Bed | 2 Bed + Den | 3 Bed | 3 Bed + Den | |
|---|---|---|---|---|---|---|---|
| Price Range | No Data | $485,000 - $635,000 | $590,000 - $770,000 | $720,000 - $1,070,000 | $893,000 | $875,000 - $1,340,000 | No Data |
| Avg. Cost Per Sqft | No Data | $1,171 | $1,189 | $1,142 | $1,298 | $1,138 | No Data |
| Price Range | $1,995 | $1,500 - $2,700 | $2,295 - $3,200 | $1,380 - $3,500 | $2,950 - $3,700 | $1,350 - $5,450 | No Data |
| Avg. Wait for Unit Availability | No Data | 53 Days | 53 Days | 42 Days | No Data | 87 Days | No Data |
| Avg. Wait for Unit Availability | 166 Days | 6 Days | 4 Days | 4 Days | 17 Days | 12 Days | No Data |
| Ratio of Units in Building | 1% | 19% | 32% | 30% | 7% | 9% | 1% |
Total number of units listed and sold in Queen West
