Maintenance Fees
Ten York vs The Waterfront Area


Condo
$574/mth
$3,521 (2023)
$1,102/sqft
Balcony
None
North East
November 25, 2024
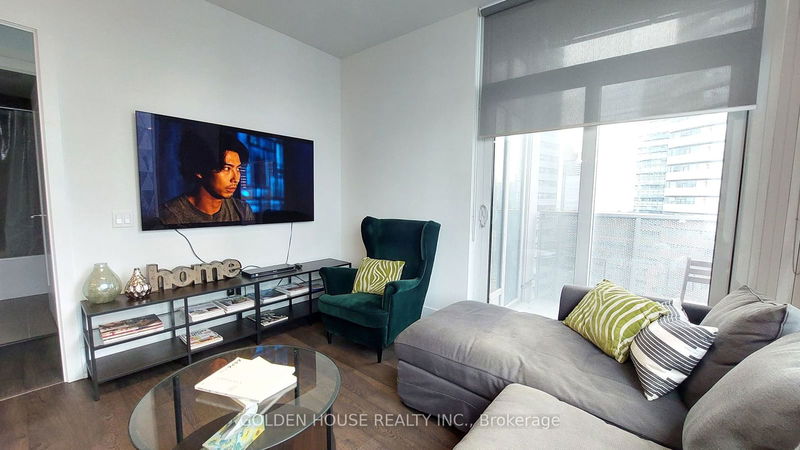
Built by on of Canada's best developer, Tridel. This luxurious condominium is located in prime downtown Toronto. This luxury 830 Sq ft North East Corner Suite features 2 Bedrooms and Two Bathrooms. Floor to Ceiling Windows With a Gorgeous View of the City and Lake. Lots of natural light. High End Modern Kitchen and top of the line Finishes. Steps away from Union Station, TTC & GO Networks, Path Network, Lake Ontario, Harbour Front, Fine Dining, LCBO, Longos, Maple Leaf Square and the Rogers Centre. **EXTRAS** Built in appliances, fridge, stove, microwave, dishwasher. Washer and dryer.
golden house realty inc.MLS® #C10441541
Based on the dissemination area as defined by Statistics Canada. A dissemination area contains, on average, approximately 200 – 400 households.
| Studio | 1 Bed | 1 Bed + Den | 2 Bed | 2 Bed + Den | 3 Bed | 3 Bed + Den | |
|---|---|---|---|---|---|---|---|
| Price Range | No Data | $590,000 - $736,000 | $625,000 - $758,000 | $895,000 - $1,015,000 | No Data | $1,698,000 - $1,705,000 | No Data |
| Avg. Cost Per Sqft | No Data | $1,139 | $1,101 | $1,199 | No Data | $1,390 | No Data |
| Price Range | No Data | $2,150 - $3,100 | $1,500 - $2,900 | $3,100 - $7,200 | No Data | $5,350 - $7,000 | No Data |
| Avg. Wait for Unit Availability | No Data | 60 Days | 53 Days | 76 Days | 216 Days | 561 Days | No Data |
| Avg. Wait for Unit Availability | No Data | 8 Days | 11 Days | 18 Days | 327 Days | 57 Days | 1059 Days |
| Ratio of Units in Building | 1% | 43% | 30% | 20% | 2% | 6% | 1% |
Total number of units listed and sold in Waterfront
