Maintenance Fees
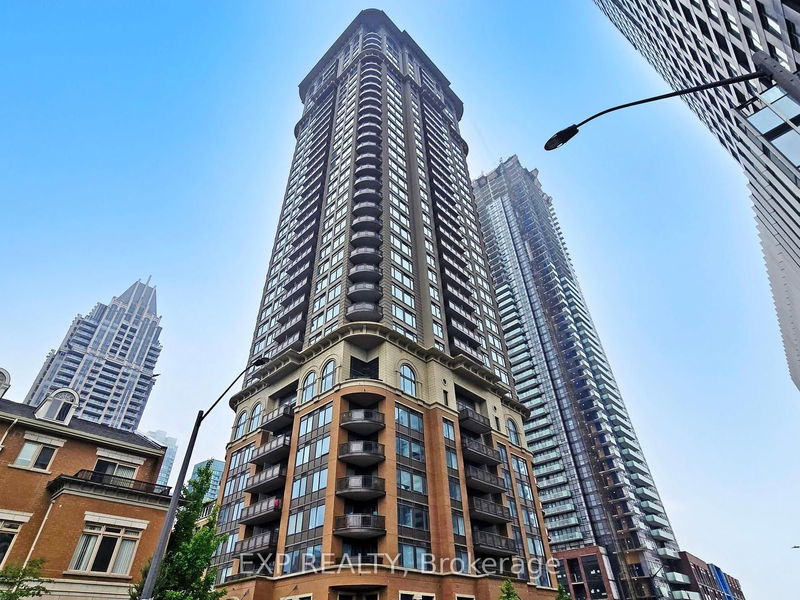
Chicago Condos vs The Downtown Core Area


Condo
$512/mth
$2,461 (2024)
$777/sqft
Balcony
Owned
South
April 1, 2025
Step into your urban condo retreat in the heart of Mississauga! This stunning 1-bedroom plus media nook, 1-bath unit in the Chicago building boasts 611 sq. ft. of modern living space, offering breathtaking southern lake views from the 22nd floor. The open-concept design enhances space and natural light. Indulge in premium amenities, including a rock climbing wall, rooftop club, outdoor BBQs, virtual golf, party/movie room, billiards, dining room, sauna, gym, indoor pool, and whirlpool. This unit includes 1 parking spot and 1 locker for added convenience. Enjoy luxury living steps from Square One Mall, with premier shopping, dining, and entertainment at your doorstep.
exp realtyMLS® #W12016931
Based on the dissemination area as defined by Statistics Canada. A dissemination area contains, on average, approximately 200 – 400 households.
| Studio | 1 Bed | 1 Bed + Den | 2 Bed | 2 Bed + Den | 3 Bed | 3 Bed + Den | |
|---|---|---|---|---|---|---|---|
| Price Range | $430,000 | $482,000 - $537,000 | $495,000 - $600,000 | $565,000 - $623,800 | $840,000 | No Data | No Data |
| Avg. Cost Per Sqft | $1,034 | $839 | $784 | $784 | $818 | No Data | No Data |
| Price Range | $1,900 - $2,200 | $1,950 - $2,500 | $2,400 - $2,750 | $2,500 - $3,200 | $2,900 - $3,500 | No Data | No Data |
| Avg. Wait for Unit Availability | 159 Days | 26 Days | 25 Days | 78 Days | 125 Days | 1449 Days | 296 Days |
| Avg. Wait for Unit Availability | 57 Days | 12 Days | 11 Days | 43 Days | 128 Days | 369 Days | 113 Days |
| Ratio of Units in Building | 6% | 33% | 39% | 11% | 7% | 2% | 6% |
Total number of units listed and sold in Downtown Core
