Maintenance Fees
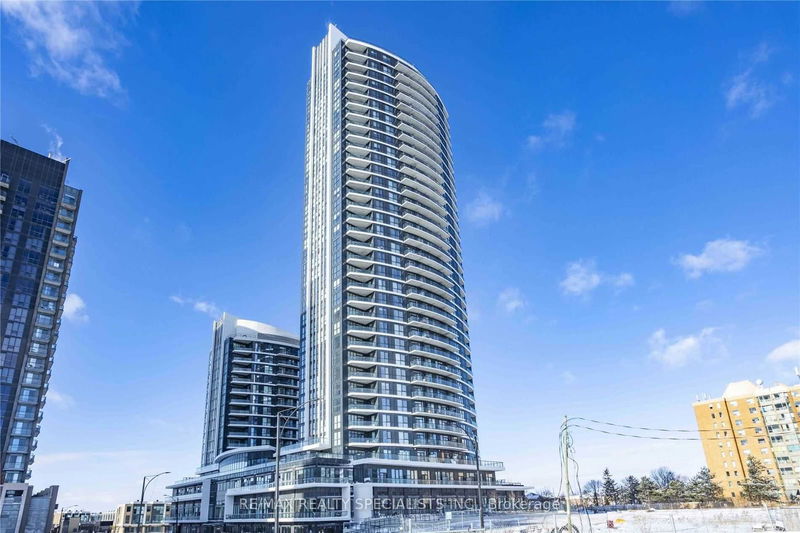
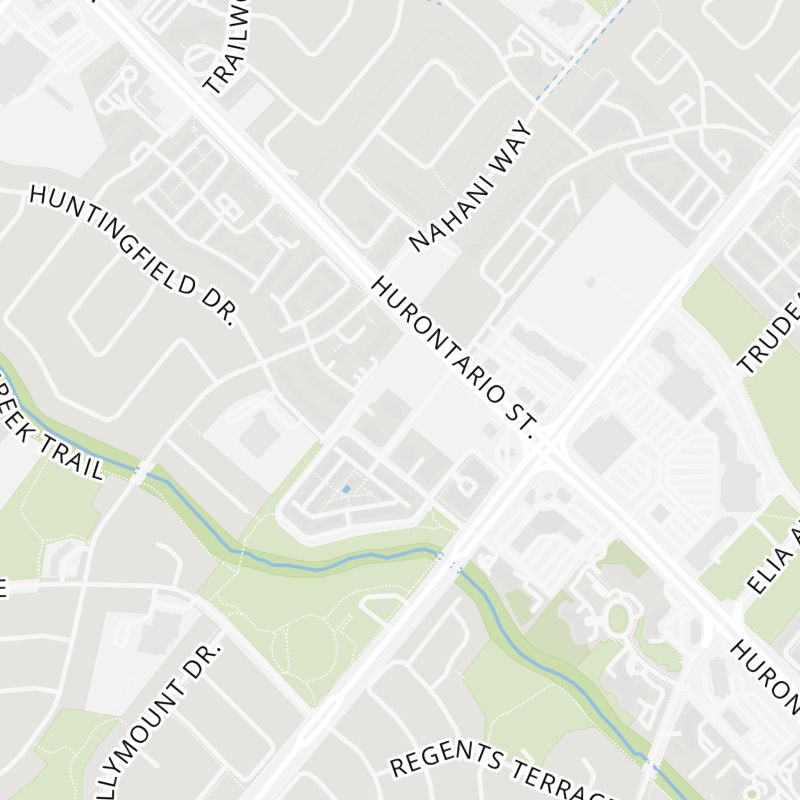
Perla Towers vs The Hurontario Area


Condo
January 5, 2025
1 Year
Yes
Balcony
No
South
Owned
Ensuite
Sought After Areas! Soaring 9 Ft Ceilings, King Sized Master Bedroom, Bright Living Spaces, Luxurious Open-Concept Kitchen, Ss/ Appliances, Quartz Counters, Separate Den Perfect For Working From Home. W/O To Private Balcony Extending The Living Space Outdoors With Stunning View. 1 Parking And 1 Locker Included. Very Well Managed Building* No Smoking* No Pets* Available Fully Furnished for $2,895*
re/max realty specialists inc.MLS® #W11884213
Laminate, Walkout To Balcony, Open Concept
Laminate, Combined with Living, Open Concept
Modern Kitchen, Granite Counter, Stainless Steel Appliances
Laminate
Large Closet, Large Window
Based on the dissemination area as defined by Statistics Canada. A dissemination area contains, on average, approximately 200 – 400 households.
| 1 Bed | 1 Bed + Den | 2 Bed | 2 Bed + Den | 3 Bed | 3 Bed + Den | |
|---|---|---|---|---|---|---|
| Price Range | $460,000 - $518,000 | $518,500 - $610,000 | No Data | $768,000 - $790,000 | No Data | No Data |
| Avg. Cost Per Sqft | $872 | $854 | No Data | $742 | No Data | No Data |
| Price Range | $2,200 - $2,650 | $2,300 - $2,600 | $2,800 | $2,800 - $3,500 | No Data | No Data |
| Avg. Wait for Unit Availability | 43 Days | 70 Days | No Data | 34 Days | 370 Days | No Data |
| Avg. Wait for Unit Availability | 16 Days | 29 Days | 246 Days | 10 Days | 574 Days | No Data |
| Ratio of Units in Building | 31% | 19% | 3% | 47% | 2% | 1% |
Total number of units listed and leased in Hurontario
